Cheese Production, Consumption and Trade: Official Statistics
Picture a milk tanker beside a pallet of Cheddar.
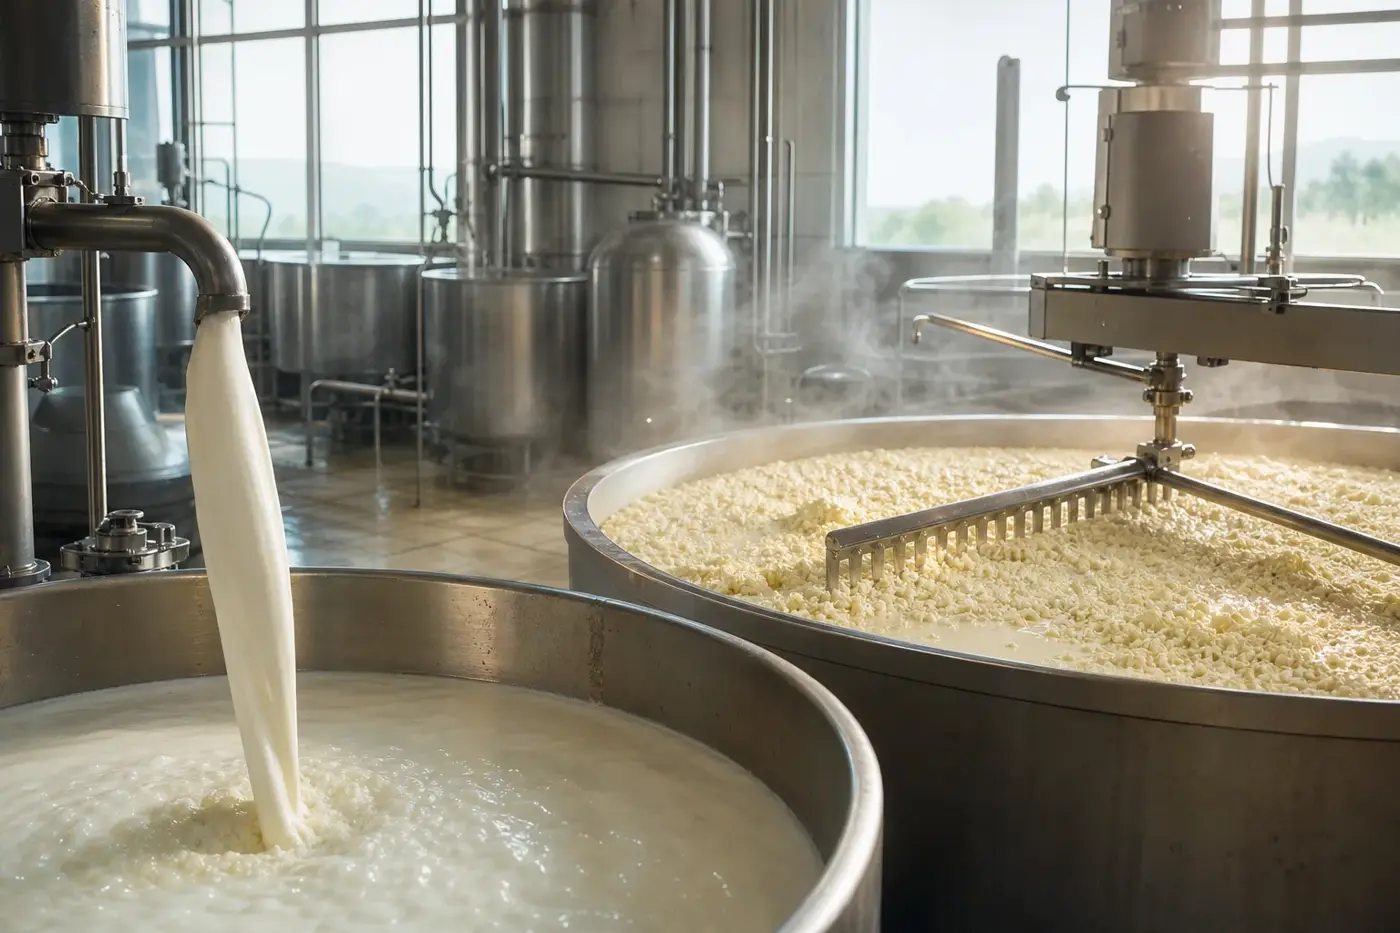
Picture a milk tanker beside a pallet of Cheddar. There is a considerable amount of dairy arithmetic parked between them. In Defra’s September 2026 statistics, a kilogram of Cheddar accounts for 9.5 litres of milk; a kilogram of cottage cheese or fromage frais accounts for just 3.6 litres. Before you count a single cheese, you need to distinguish the milk arriving from the cheese leaving. [1]
Follow that cheese across a border or into your shopping basket, and the question changes. Production statistics measure manufacture; trade statistics track international shipments; purchase and supply figures describe food bought or available for use. In the UK, Defra records milk used for cheesemaking, HMRC records international shipments, and Family Food records household purchases. Keep those distinctions close as you read the figures together. [1][2][3]
Start at the dairy: follow the milk
You cannot compare a milk tanker and a pallet of cheese by weight alone. Defra estimates wholesale cheese production from milk utilisation, using conversion factors informed by the dairy industry. Actual factors fluctuate, so the statistics use averages.
Those September 2026 factors apply to specified categories. They are not cheesemaking recipes, however appealing a shortcut that might seem. For the manufacturing story, follow how cheese is made. [1]
Defra’s annual milk balance records 4,816 million litres allocated to cheese manufacture in 2025, compared with 4,629 million litres in 2024. That tells you about milk entering a manufacturing category. It does not give you the weight of cheese emerging from it. [2]
The cheese output series picks up the story in tonnes of finished product. Read it alongside the milk balance: one describes the raw material allocated to cheesemaking, the other the manufactured cheese. To move between them, you need the appropriate conversion factor, not a simple comparison of weights.
Meet the big producers on equal terms
The United States leads the individual countries in the USDA’s selected-country cheese table, with 6,463,000 tonnes recorded in 2024. The European Union’s 10,803,000 tonnes is larger, but belongs in a separate place. You are comparing a group of countries with a single national producer. [4]
Within the EU, Germany leads Eurostat’s 2024 dairy figures with 22.5% of cheese output, followed by France at 17.8%. The accompanying release puts total EU cheese production at approximately 10.8 million tonnes. Those are your European leaders for that particular dataset and year. [5]
For a worldwide country ranking, you need the same cheese commodity for every country. The FAO series displayed through UNdata, for example, is explicitly titled “Cheese from whole cow milk”. That is narrower than a total covering cheeses made from every milk species. Select the same commodity in FAOSTAT before comparing countries. [6]
To build a worldwide ranking that another reader can reproduce, retain the same commodity, production element, reference year and unit for every country. Keep regional aggregates separate. Preserve estimate flags, too: they show you both what was counted and how each observation was recorded.
Britain’s cheese balance: arrivals and departures
The UK imported more than twice as much cheese as it exported by weight in 2025. Defra’s publication of HMRC trade statistics records 472,000 tonnes of imports and 207,000 tonnes of exports. Subtract those published rounded totals and you get net imports of approximately 265,000 tonnes. [3]
That trade category takes in fresh cheese and curd, grated or powdered cheese, processed cheese and blue-veined cheese. It is a broad category. Any UK production figure you put beside it needs comparable coverage. [3]
Before you combine production and trade into a consumption estimate, reconcile the manufacturing category with the customs category. Pay particular attention to processed cheese and curd. Matching the year is essential; matching the product matters just as much.
The table below keeps each original measure visible. Litres of milk, tonnes of manufactured cheese and tonnes crossing a border tell related stories. They are not interchangeable totals.
| Measure and territory | Period covered | Figure and unit | What you are counting and where to find it |
|---|---|---|---|
| UK milk allocated to cheese | Calendar 2025 | 4,816 million litres | Annual milk supply balance, Defra Table 8.6d. [2] |
| UK cheese production | Calendar 2025 | Comparable figure needed | You need the full source and category coverage for comparison. [4] |
| UK cheese imports | Calendar 2025 | 472,000 tonnes | HMRC cheese category, published by Defra, Table 13.3b. [3] |
| UK cheese exports | Calendar 2025 | 207,000 tonnes | The same trade category, Table 13.3a. [3] |
| UK cheese production | September 2026 | 38,800 tonnes | Monthly dairy production estimate, Defra Table 2.1. [1] |
| EU cheese production | Calendar 2024 | Approximately 10.8 million tonnes | Eurostat dairy product output by weight. [5] |
September’s production figure covers one month; the other UK observations cover a year. Multiply that month by twelve and you make an assumption about the rest of the year. You do not reproduce an official annual total.
Available cheese has not necessarily reached your plate
To find cheese available for domestic use, you start with a balance. Here is the calculation you need:
Production + imports − exports + opening stocks − closing stocks
When stocks rise, less cheese remains available for use during the period. Release cheese held from an earlier period, and availability increases. Your result is domestic availability before any further deductions or adjustments required by the chosen methodology.
Make clear whether you have measured or omitted stocks, processing uses and losses. If your calculation includes only production plus net imports, call it exactly that. Calling it “cheese eaten” skips storage, processing and waste, along with any mismatch between the underlying commodity series.
Processing can also make the same cheese appear twice. If cheese becomes an ingredient in another cheese product, counting both stages as additional final supply risks double counting the material. In the other direction, a narrow table of cheese products may omit cheese incorporated into prepared foods. Set your boundary before reaching for the calculator.
Publish the formula beside your result, identify every input and retain the source precision. If a required component is unavailable, describe the calculation that remains. An assumed zero hides the gap rather than filling it.
Cheese per person: what is everyone getting a share of?
A per-person figure is only as useful as the quantity you divide. The arithmetic itself is straightforward:
Annual cheese quantity in tonnes × 1,000 ÷ corresponding population
Use apparent supply, and your result is kilograms available per person per year. Use recorded purchases, and it remains a purchase measure. Dividing by population does not turn either figure into a direct observation of food swallowed.
For a fair international comparison, match product coverage, year, stock treatment and treatment of losses. Document the population source, too. Keep household purchases per person per week separate from national availability per person per year. Both the units and the underlying observations differ.
Before you ask which country has the largest number, ask what each number contains. Does it cover cheese bought separately, cheese in meals, supplies to institutions or the entire domestic commodity balance? Put those boundaries beside the figures, where you can use them. A ranking still needs all that detail.
Inside the Family Food shopping diaries
Family Food takes you to the shopping basket, rather than the dairy or the border. Its FYE 2025 release was published on 17 September 2026 and corrected on 18 September. Keep that financial-year reference period distinct from calendar-year production and trade figures. [7]
The survey gathers information from a sample of UK households through two-week purchase diaries, supported by till receipts. It covers household food and drink purchases and purchases eaten out. Quantities are recorded where possible and otherwise estimated. The publication draws on the Family Food module of the Living Costs and Food Survey. [8]
These records let you explore purchasing patterns. For a cheese purchase comparison, you need the published category codes, units and sampling information. Defra provides separate files for household purchases and eating out purchases. [9]
Buying and eating are different events, however closely they may follow one another. A purchase diary records food acquired during its observation period; that food may enter household stocks, leave them, be shared or be discarded. Treating purchases as an individual’s intake therefore requires additional assumptions.
Read the eating-out categories separately before attempting a total. A purchased meal and a separately purchased piece of cheese are different observations. Allocating part of a meal to cheese needs a documented method. Keep the original categories visible so another reader can follow how you assembled the total.
The export leaders change with the question
The Netherlands leads the reporting countries by export value in World Bank WITS’s 2024 HS 040690 table, followed by Germany, France, Italy and Ireland. WITS presents UN Comtrade observations by product code. This table is labelled “Cheese, nes”, meaning cheese not elsewhere specified within the classification. [10]
Sort those same observations by reported weight, and the order changes. The Netherlands recorded 740,994 tonnes, Germany 633,191 tonnes, France 360,751 tonnes, Ireland 247,446 tonnes and Italy 213,214 tonnes. Ireland moves ahead of Italy. These figures cover 040690, not the entire cheese-and-curd heading. [10]
Every trade ranking needs two clear labels: the product and the measure. Value and tonnes answer different questions, even when you keep the year and country coverage identical. The product code tells you which cheese is included. The measure tells you what “leading” means.
For value comparisons, retain the valuation basis and currency conversion method. For questions about physical supply, use the reported weight field. Look at value separately when exploring commercial trade patterns. Neither ordering is a substitute for the other.
Follow the cheese to its trading partners
The UK received 430,228 tonnes of EU cheese exports outside the EU in 2024, according to the European Commission’s historical dairy trade tables. The United States received 141,756 tonnes, Japan 80,923 tonnes and Switzerland 74,919 tonnes. These are destinations within the EU export dataset. They are not a ranking of worldwide imports. [11]
The bilateral table brings individual trading relationships into focus. Of the EU cheese exports recorded as going to the UK, Ireland supplied 75,063 tonnes, France 59,196 tonnes and Denmark 58,681 tonnes. That partner detail gives you a closer view than an aggregate export total can offer. [11]
For UK trade, HMRC’s overseas trade table lets you select commodity, period and trade direction, with separate measures for net mass and value. Its documentation also identifies confidential observations that have been withheld. To build worldwide import and export rankings, you need the corresponding full extraction. The same applies to UK partner figures for the complete cheese and curd heading. [12]
Under the umbrella of heading 0406
The UK Trade Tariff names heading 0406 “Cheese and curd”. Think of it as the umbrella heading. A complete extraction needs the relevant subdivisions beneath it, not just one convenient six-digit category. [13]
That breadth matters when you bring customs data and dairy production statistics together. Defra’s published trade category includes several forms of cheese. Its manufacturing statistics instead organise milk use into categories such as Cheddar, territorial cheeses and blue-veined cheese. Each classification has a different job. [1][3]
To compare them, establish a crosswalk between the production categories and customs codes. You need to know which categories correspond and which products fall inside each boundary. Before combining the figures, you need the complete operative classification and its relevant subdivisions for that crosswalk.
Count the borders, not the same cheese twice
A cheese shipment between two EU member countries crosses a national border but stays inside the EU. Whether you count it as external trade depends on the geographic boundary of your analysis. Choose that boundary before you start adding flows.
The Commission’s cheese tables explicitly identify exports to third countries. Add this EU aggregate to member-country totals and you mix geographic levels. Choose a clearly defined bloc view or a country view. Distinguish intra-EU movements from extra-EU movements throughout. [11]
Reexports offer another route to double counting. Goods can cross more than one border between manufacture and final use, so keep gross exports, domestic production and domestic-origin exports separate. Before treating export performance as evidence of manufacturing strength, look at how the dataset treats reexports.
Keep gaps in reporting visible, too. HMRC’s table identifies withheld confidential data. An unavailable observation should stay unavailable in your working table. It must not become zero simply because your spreadsheet would prefer a number. [12]
Keep your figures fresh, and keep their history
Start with Defra’s Latest statistics on milk utilisation by dairies page, updated on 5 November 2026. It links the milk availability, usage and production dataset. You will also find the separate supplies-of-milk-products dataset, bringing together production, imports, exports and supply. [14]
Save a dated copy of each extraction. The latest milk notice reports revisions from January 2025 after Northern Ireland estimates were replaced with actual data. Family Food also records a correction to its September 2026 release. Your extraction date is part of the evidence, not merely administrative detail. [1][7]
For international comparisons, preserve the FAOSTAT commodity selection, Eurostat dataset identifier and customs classification with your downloaded observations. A newer release may revise an older year. Equally, the latest year suitable for comparison may still come before the newest national monthly observation.
A useful statistical table lets another reader rebuild it. Give each figure a defined product, a stated territory, a matching period, an explicit unit and a traceable release. Those details turn an impressive number into a reference you can actually use.
Questions people ask
How much cheese did the UK import and export in 2025?
The UK imported 472,000 tonnes and exported 207,000 tonnes of cheese in 2025. Subtracting the published rounded totals gives net imports of approximately 265,000 tonnes.
Which country produces the most cheese?
The United States leads the individual countries in the USDA’s selected country table, with 6,463,000 tonnes in 2024. A worldwide country ranking has not yet been verified on the page.
How much milk does the UK use to make cheese?
Defra’s annual milk balance records 4,816 million litres allocated to cheese manufacture in 2025, compared with 4,629 million litres in 2024. These figures describe milk entering the manufacturing category, not the weight of cheese produced.
How is cheese available for domestic use calculated?
The supply balance adds production, imports and opening stocks, then subtracts exports and closing stocks. This describes domestic availability before further deductions or adjustments, not necessarily cheese eaten.
How does Family Food record cheese purchases?
Family Food gathers information from a sample of UK households through purchase diaries kept for two weeks, supported by till receipts. No cheese purchase quantity has yet been extracted for the page, and purchases do not directly measure individual intake.
Sources
- Defra, Milk utilisation, statistics notice (data to September 2026), updated 5 November 2026. Tables 2.1 and 4.1, methodology and revisions statement.
- Defra, Agriculture in the United Kingdom 2025: Chapter 8, Livestock, 2026 edition. Table 8.6d, milk supply and use.
- Defra, using HMRC statistics, Agriculture in the United Kingdom 2025: Chapter 13, Overseas trade, 2026 edition. Tables 13.3a and 13.3b and commodity notes.
- USDA Foreign Agricultural Service, Dairy: World Markets and Trade, July 2026. “Cheese Production and Consumption: Summary For Selected Countries”, thousand metric tonnes.
- Eurostat, Milk production reached 161.8 million tonnes in 2024, 20 November 2025. Cheese output and national production shares; dataset
apro_mk_pobta. - United Nations Statistics Division, displaying FAOSTAT data, Cheese from whole cow milk, live database view.
- Defra, Family Food FYE 2025, published 17 September 2026, corrected 18 September 2026. Release and correction history.
- Defra, Family food statistics, collection page, updated September 2026. Survey description and coverage.
- Defra, Family food datasets, updated 17 September 2026. Purchase datasets, codebanks and glossary.
- World Bank WITS, using UN Comtrade, Cheese, nes exports by country, 2024, HS 040690. Reporting-country values and quantities.
- European Commission, using Eurostat Comext, EU dairy historical trade series, tables for 2024 cheese exports to third countries by origin and destination.
- HMRC, Build an overseas trade data table, live service and accompanying guidance, accessed November 2026.
- UK Trade Tariff, heading 0406, Cheese and curd, official tariff API record, accessed November 2026.
- Defra, Latest statistics on milk utilisation by dairies, updated 5 November 2026. Dataset descriptions and release history.
Researched through official statistical releases, dataset documentation and customs classification records, with calculations identified separately from published observations.
Last checked: November 2026.
Last checked November 2026.
The editors suggest you read next
The Global Cheese Industry Explained
At the farm gate, a delivery of milk begins its journey with the clock already ticking.