Cheese and Climate: Methane and Emissions
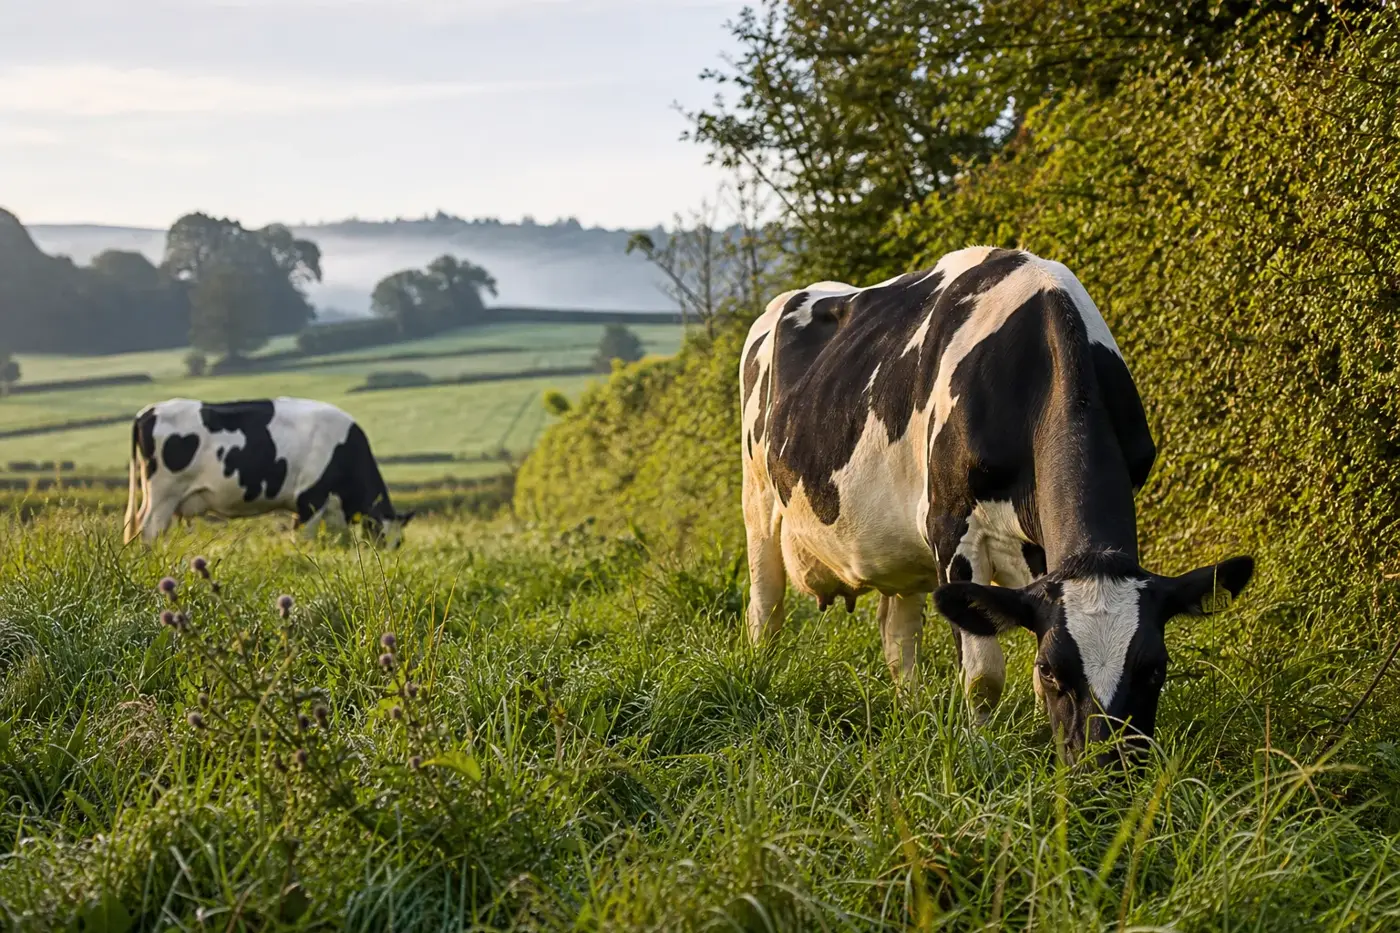
A cow belches.
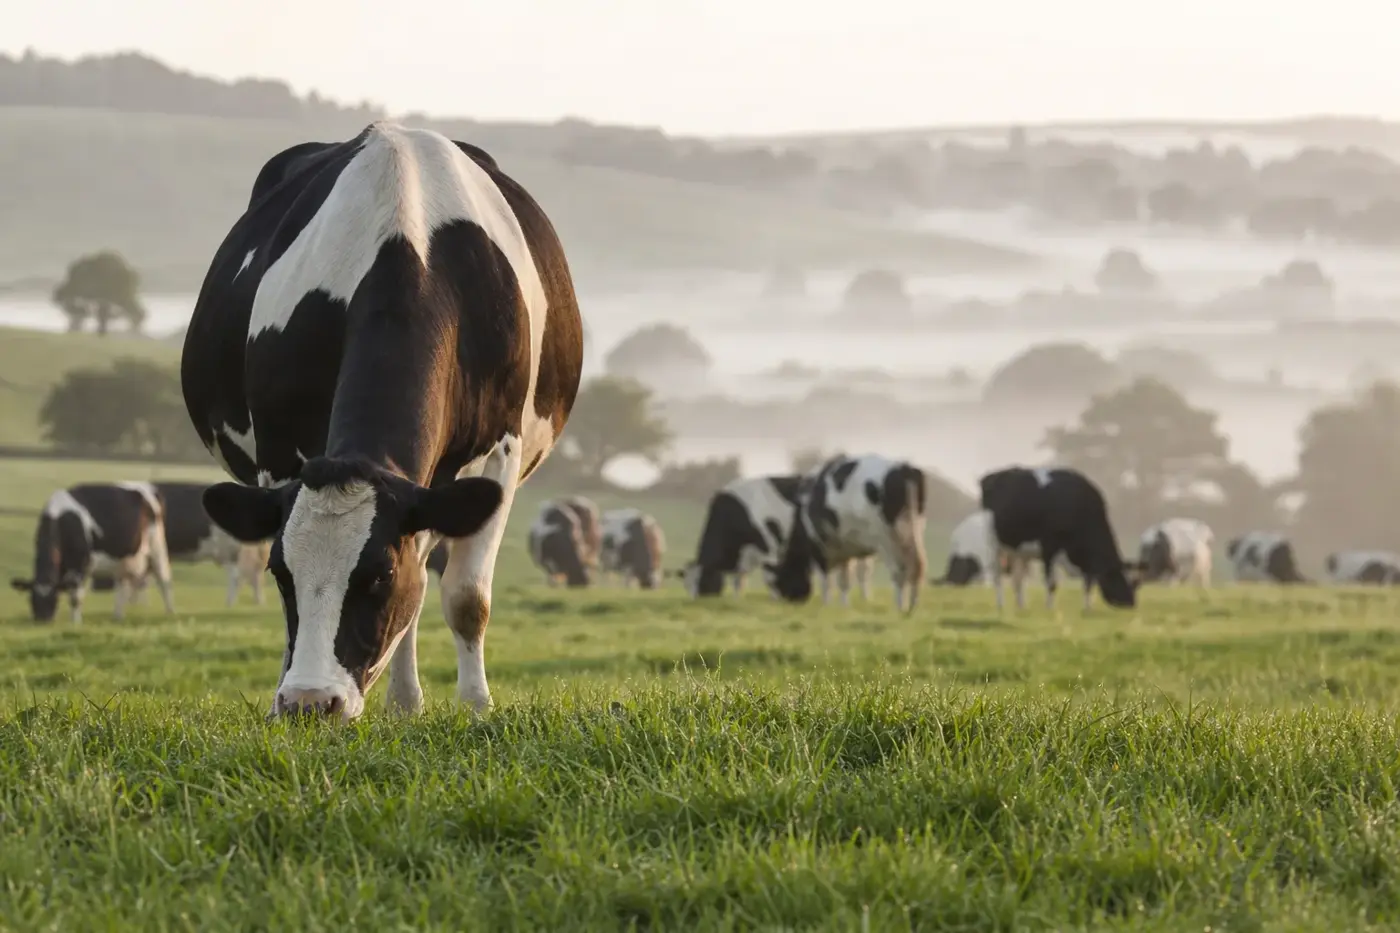
A cow belches. Her milk has not reached the vat, but your cheese's climate story is already under way. Microbes in her digestive system make methane as they break down feed. [1][2]
Follow that milk towards your cheeseboard and the picture grows. Farm practices, how much milk becomes cheese and where the calculation starts and stops all shape the footprint. The journey to your shop is usually only part of it. [1][2][3]
Inside the rumen, where it all begins
Inside the cow, the rumen works as a fermentation chamber. Microbes break down plant material, while methane-producing archaea use the products of that fermentation, including hydrogen, to make methane. This is enteric fermentation: fermentation inside the digestive tract. [1][2]
Much of that gas leaves through the mouth in belches, not through flatulence. Sheep and goats share the same broad digestive mechanism. The less glamorous end of the animal gets rather too much credit. [1][2]
The UK inventory counts digestive methane separately from methane released during manure management. On the farm, that distinction matters: capturing gas from a slurry store cannot capture what a cow breathes or belches while eating. Both sources belong in the farm footprint, but each needs its own intervention. [5]
Why methane makes timing matter
Methane is powerful, but relatively short-lived. The IPCC Sixth Assessment Report gives it an atmospheric perturbation lifetime of about 12 years. Carbon dioxide has no comparable single lifetime: some of an emission stays for centuries or longer. Nitrous oxide, another agricultural greenhouse gas, persists for about a century. [4]
To bring these gases together, you will see carbon dioxide equivalent, written CO2e. It uses a chosen metric, often global warming potential, or GWP. GWP compares the radiative forcing accumulated over a stated period after a gas is emitted with that following an emission of carbon dioxide. [4]
Choose 20 years and methane gets greater relative weight than over 100 years. So a footprint's metric, time horizon and assessment version belong beside its number. Without them, you have only part of the story. [4]
Biogenic carbon comes from recently living material, but methane containing it still causes warming. Repeated emissions maintain an elevated methane concentration; rising emissions increase warming. Cutting methane can reduce its warming contribution relatively quickly, while cutting carbon dioxide prevents further cumulative warming. [4]
Follow your cheese beyond the cow
Manure can release methane when organic material decomposes without oxygen, including in liquid storage. Nitrogen in manure and fertiliser can become nitrous oxide through microbial processes in soils and manure systems. The UK inventory separates these categories, including direct soil emissions and indirect emissions associated with nitrogen losses. [2]
According to Defra's inventory-based account, enteric fermentation leads UK agricultural methane emissions, followed by manure management. Agricultural soils dominate nitrous oxide emissions, with contributions from fertiliser, manure deposited during grazing, manure applications and nitrogen leaching. This is the UK picture, not a universal percentage breakdown for your cheese. [5]
Beyond the farm comes the wider supply chain: growing feed, making fertiliser, changing land use, running machinery and powering processing, refrigeration and transport. Packaging contributes too. A local dairy may shorten the journey yet still have substantial farm emissions, so distance alone cannot tell you the balance. The global food comparison below covers inputs through to retail, not transport alone. [3]
At the vat: what stays and what drains away
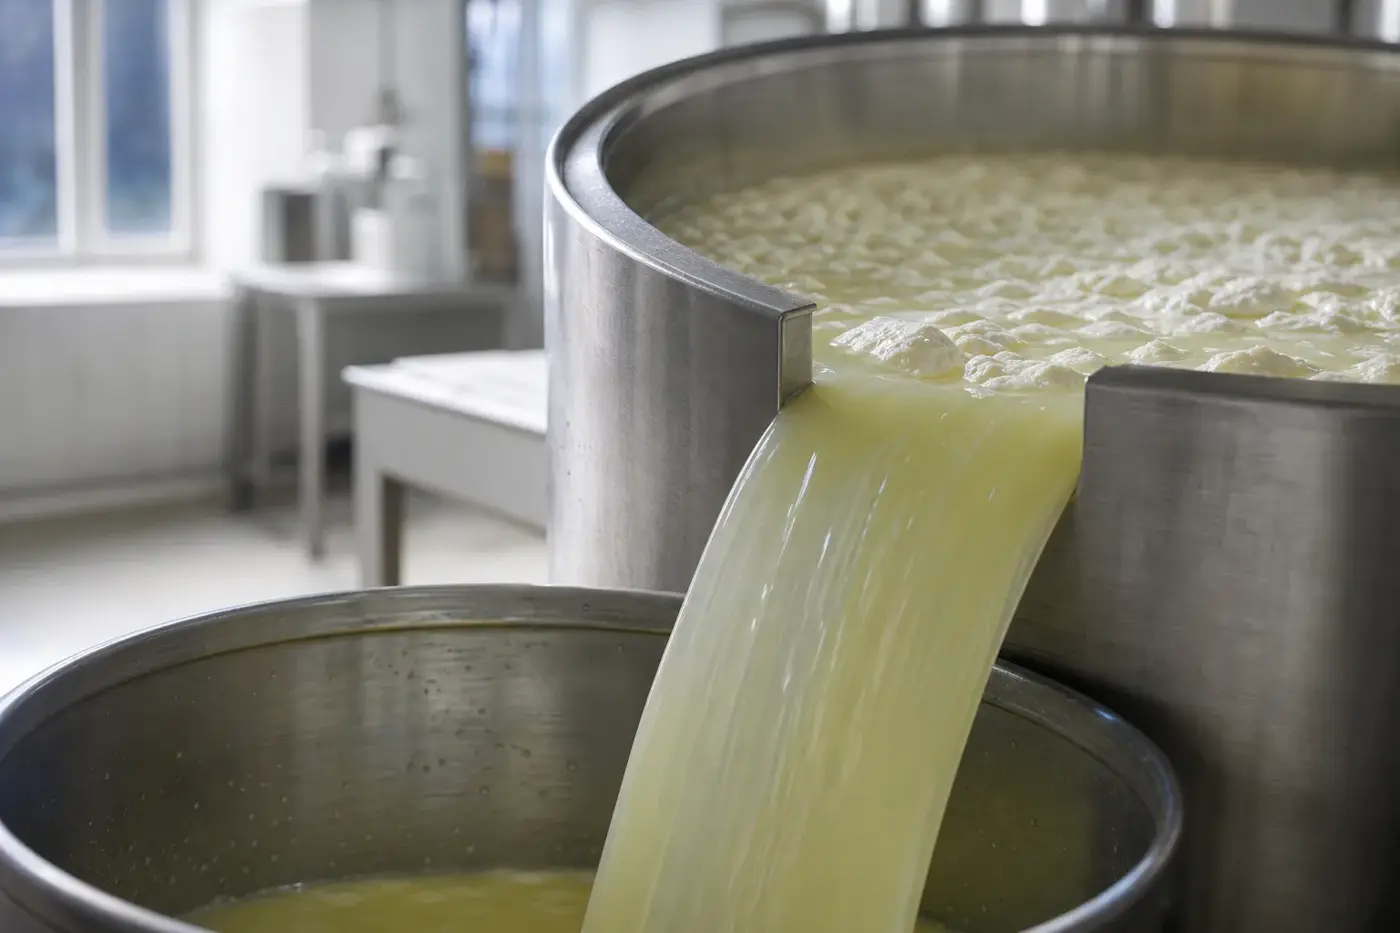
Watch the whey drain away and you are watching cheese retain milk solids. Milk fat and protein matter to cheesemaking output, alongside the volume of milk used. The accounting follows those ingredients. [6]
With other inputs unchanged, using more milk per kilogram of cheese brings more of the milk's allocated footprint into that kilogram. Wetter cheese retains more water in its finished weight; drier cheese concentrates solids. Ripening losses can change the weight used in the calculation again. No single litres-of-milk figure can meaningfully describe every cheese. [6]
You can explore the process in how cheese is made. When comparing footprints, ask when the cheese was weighed: fresh, after ripening or at sale.
Give that footprint number a closer look
A lifecycle assessment, or LCA, estimates impacts across a defined system. FAO's dairy guidance makes functional units, system boundaries and allocation explicit methodological choices. Allocation means sharing impacts among outputs, rather than automatically giving everything to one product. [6]
Before you compare two headline numbers, pause over the details. These questions help you see whether you are comparing like with like.
| What to look for | Your question to ask |
|---|---|
| Unit | Is this per kilogram of cheese, serving or quantity of protein? |
| Boundary | Does the calculation stop at the farm, dairy, shop or household? |
| Shared products | How does it treat milk, meat, cheese, whey and cream? |
| Climate metric | Which GWP, time horizon and IPCC version does it use? |
| Evidence | Which farms, production year, measurements and assumptions sit behind it? |
For cheese and whey, ask whether the calculation uses physical relationships, product mass, dry matter or economic allocation, and why. Changing allocation can change cheese's reported footprint without changing the emissions released by the whole dairy system. That distinction deserves your attention when reading a report. [6]
Where cheese sits beside other foods
A global synthesis published in Science in 2018 combined 570 studies covering about 38,700 farms in 119 countries. It harmonised methods and followed supply chains through retail. For greenhouse gas emissions per quantity of protein, its results put cheese above plant protein foods such as peas and tofu. [3]
Dedicated beef production generally sits higher. Poultry, eggs and pork have different distributions, with overlap between products and producers. There was substantial variation within food categories too, so a category cannot tell you everything about an individual producer. [3]
The underlying data predate many current practices. Keep that in mind when applying this widely used comparison to a particular food or producer. [3]
Your comparison unit matters as well. Equal protein does not mean equal calcium, energy or other nutrients. When planning a meal, consider the food's role and the overall meal alongside its footprint. [3][6]
More milk, less methane: look at both totals
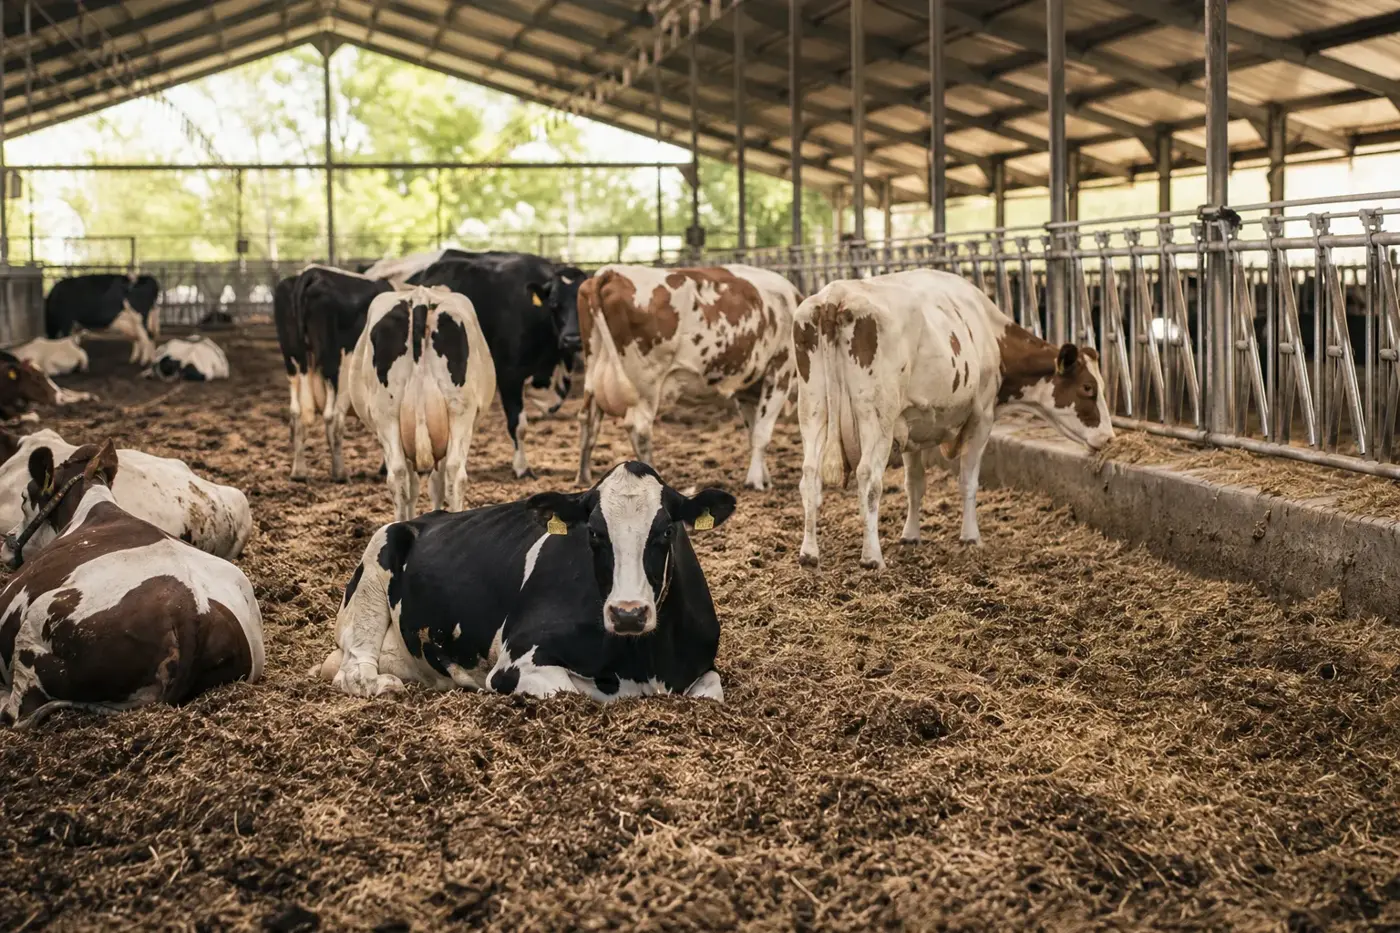
More milk per animal can spread maintenance-related emissions over more output. But the full result also depends on feed production, manure handling and replacement animals. Ask for both emissions per unit of output and total farm emissions: improving one does not automatically improve the other. Use the same test when comparing grazing and housed systems. [2]
Feed interventions need evidence from animals, not laboratory fermentation alone. In one randomised experiment, 48 dairy cows received diets with or without the methane inhibitor 3-nitrooxypropanol over a measurement period of 12 weeks. Methane fell by about 30% on average in treated cows, without reduced feed intake or milk production. The study had industry funding and industry-employed co-authors. [1]
That 30% applied to enteric methane under the trial conditions, not to cheese's entire footprint. For a practical assessment, you need to consider the ration, consistent delivery, production response and the additive's own supply chain. [1][7]
Ration changes deserve a close look in their own right. The trial authors also discuss interventions that reduce methane while impairing digestion or productivity. Less methane is not the only question to ask. [1]
From slurry store to power supply, follow the change
A manure measure should prevent methane, or capture it for use or destruction, rather than simply move it elsewhere. Ask about storage before treatment, gas leakage and what happens to the remaining material. Nitrogen still needs managing after an intervention focused on methane: the inventory records nitrous oxide as a separate emissions pathway. [2]
If a dairy claims renewable energy, find out which operations it covers: electricity, heat, refrigeration or transport. Then ask how much those operations contribute to the full footprint. That puts a visible change, such as power generation, in proportion to the less visible emissions from producing the milk.
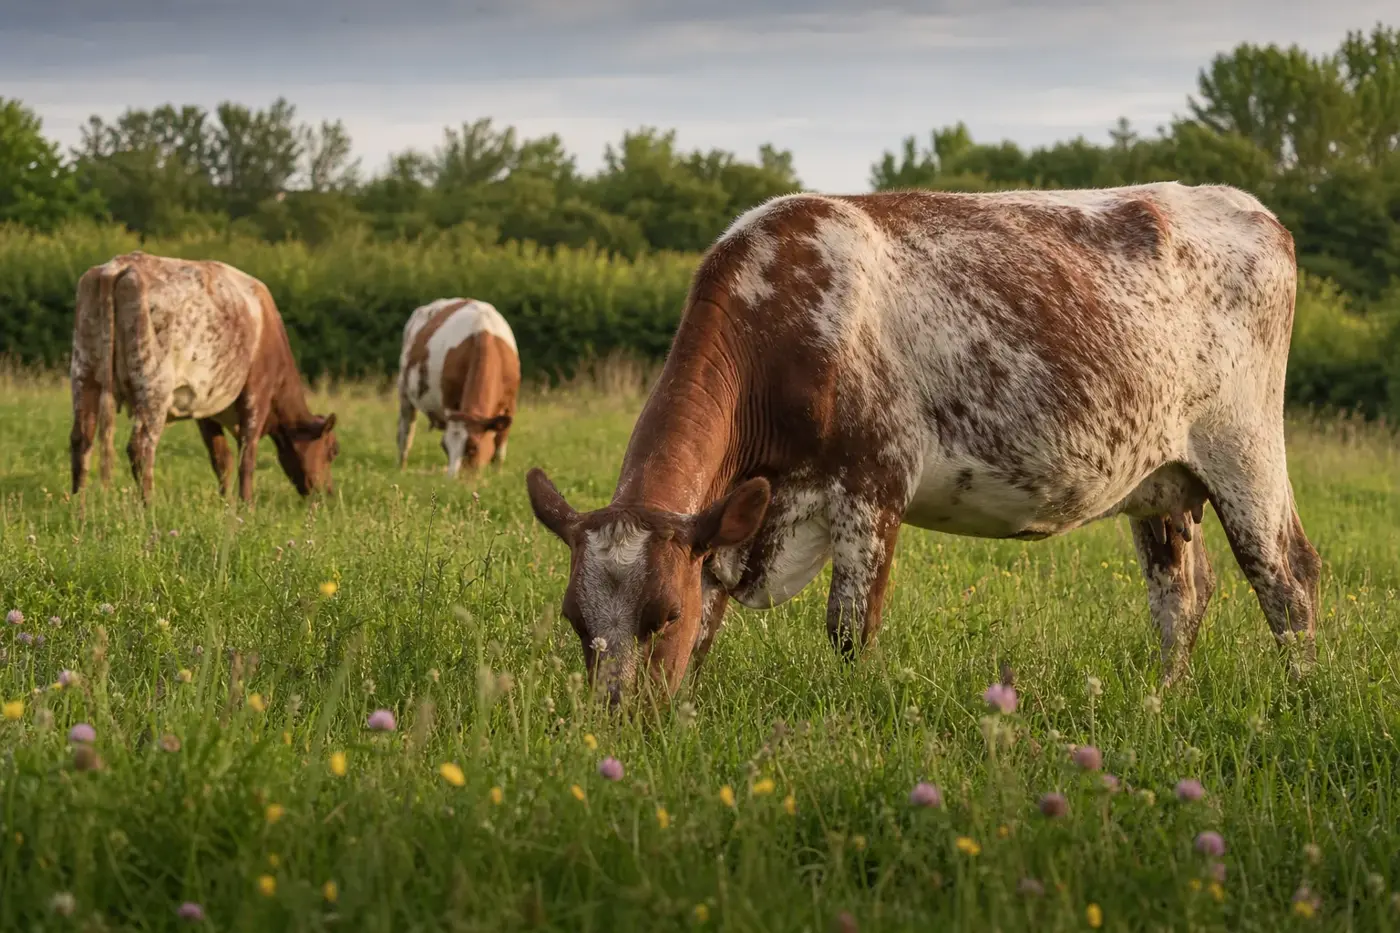
Look beneath that lovely green pasture
When you see a pasture carbon claim, start here: is it describing carbon already present, or an additional measured gain? Ask for the baseline, sampling depth, soil density, repeat measurements, uncertainty and area covered. A photograph of grass is not much use as a calculator.
Next, ask how long the gain is expected to last. What happens if management changes, and does the calculation assume gains continue indefinitely? Check whether extra fertiliser or other inputs have been counted, and whether the claim covers all farm emissions or only selected sources.
Give a carbon-storage claim weight when you can see its evidence, duration and treatment of reversals. Keep existing carbon stocks, newly stored carbon and avoided emissions as separate entries when reading the calculation. They describe different things, however green the pasture looks.
Bring good questions to your cheeseboard
Decide how much cheese you want to eat, use what you buy and favour product information that lets you inspect the calculation. If you are choosing to reduce dairy, meals built around beans, lentils or tofu offer a meaningful direction of change in the comparative research. [3]
- Plan portions around the meal, rather than automatically filling a board. Put out a modest amount first and save the rest for another occasion.
- Check what you have before buying more. Follow cheese storage guidance for handling questions beyond this climate discussion.
- Ask for the footprint report, not just its headline. Look for the production year, boundary, allocation method and explanation of any claimed carbon removals.
- Keep climate and welfare questions separate. Ask for evidence on each, rather than letting one favourable claim stand in for the other.
For product wording, turn to how to read a cheese label. A useful conversation with a producer starts with the milk supply and the calculation, then moves to packaging and delivery.
If information is missing, ask a specific question rather than filling the gap with an assumption. A clear account of milk sourcing and measured reductions is more useful for your decision than an unexplained environmental slogan.
Questions people ask
Why does cheese have a climate footprint?
Microbes in a cow’s digestive system produce methane as they break down feed. Manure, feed production, fertiliser, processing, refrigeration, transport and packaging also contribute to the wider footprint.
How long does methane stay in the atmosphere?
The IPCC Sixth Assessment Report gives methane an atmospheric perturbation lifetime of about 12 years. Carbon dioxide has no comparable single lifetime, and some of an emission persists for centuries or longer.
Is local cheese always better for the climate?
Not necessarily. A local dairy may shorten the journey to the shop while still having substantial farm emissions, so distance alone cannot describe the balance.
How does cheese compare with other foods for emissions?
A global comparison placed cheese above plant protein foods such as peas and tofu for greenhouse gas emissions per quantity of protein. Dedicated beef production generally sat higher, but variation within food categories was substantial.
Why do cheese footprint figures differ?
Calculations can use different units, boundaries, climate metrics and methods for sharing impacts among products such as cheese and whey. Changing the allocation method can change cheese’s reported footprint without changing the emissions released by the whole dairy system.
Sources
- PNAS, An inhibitor persistently decreased enteric methane emission from dairy cows with no negative effect on milk production, volume 112, number 34, 2015. Retrieved paper.
- Department for Energy Security and Net Zero, UK Greenhouse Gas Inventory, 1990 to 2024: Annual Report for submission under the Framework Convention on Climate Change, National Inventory Document, Issue 1, April 2026. Retrieved inventory.
- Science, Reducing food’s environmental impacts through producers and consumers, volume 360, 2018, retrieved copy carrying the notice of the February 2019 erratum. Author-hosted paper.
- IPCC, Climate Change 2021: The Physical Science Basis, Working Group I contribution to the Sixth Assessment Report, Chapter 7, 2021. Official chapter. The official government-distribution PDF was also retrieved; correction checks remain outstanding in the evidence log.
- Defra, Agriculture in the United Kingdom 2025, Chapter 11: Agri-environment, updated 3 September 2026. Retrieved chapter.
- FAO, Environmental performance of large ruminant supply chains: Guidelines for assessment, version 1, Livestock Environmental Assessment and Performance Partnership, 2016. Retrieved guidance.
- Food Standards Agency, Animal feed additives, GOV.UK publication and guidance landing page, published 8 December 2017. Retrieved publication page.
This desk-researched draft brings together climate assessment, UK inventory reporting, lifecycle methodology and experimental research, with outstanding verification recorded below.
Last checked: November 2026
Last checked November 2026.
The editors suggest you read next
Sustainability in Cheese: The Complete Guide
At the cheese vat, curd parts company with liquid whey.