Cheese Nutrition: Protein, Calcium and Fat
On your plate sits a 30 g piece of Cheddar beside a full 100 g helping of plain cottage cheese.
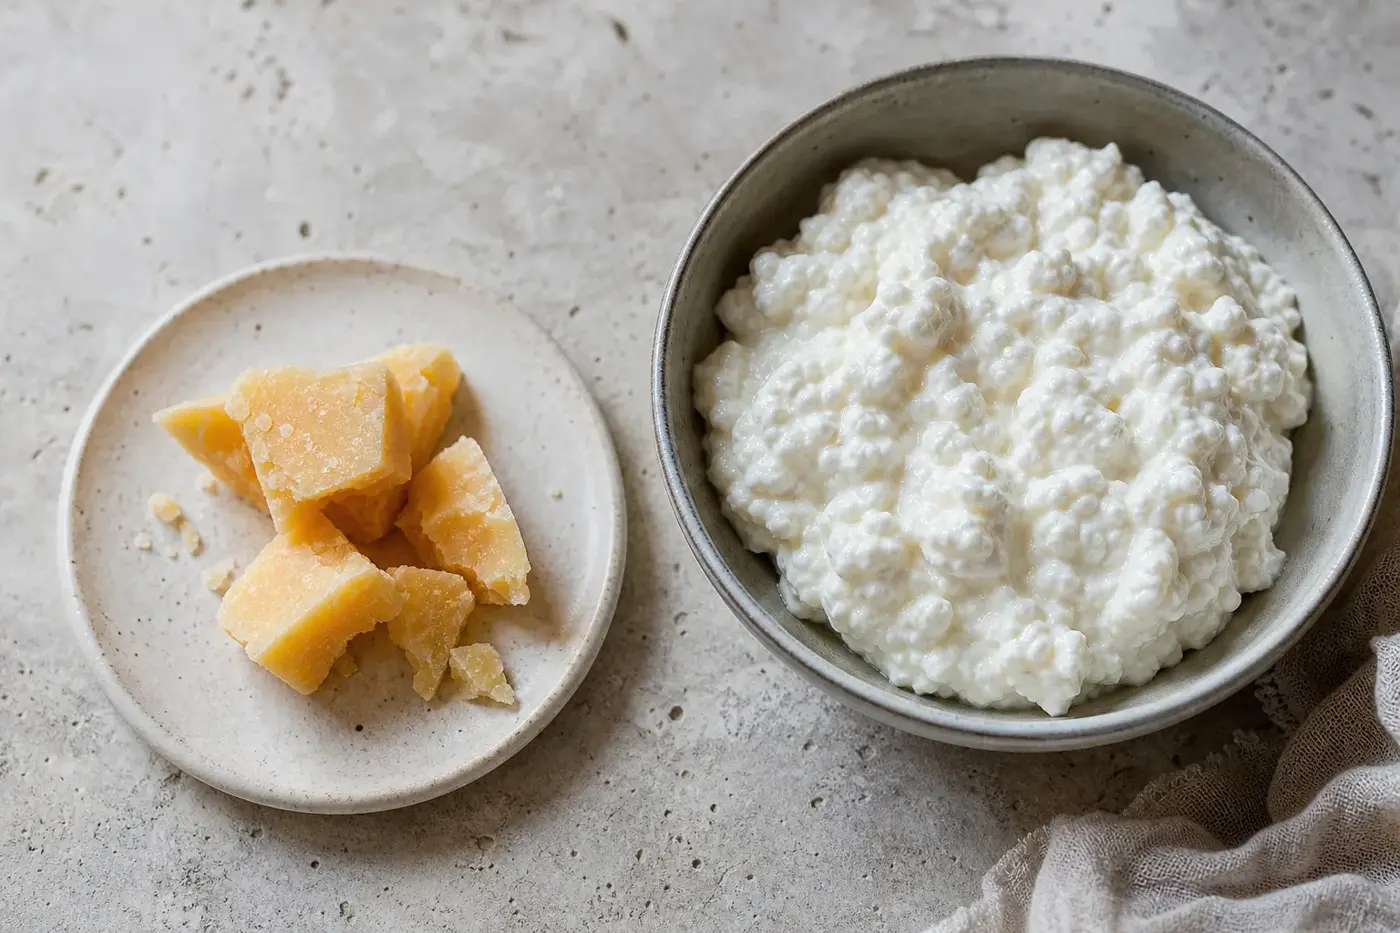
On your plate sits a 30 g piece of Cheddar beside a full 100 g helping of plain cottage cheese. The smaller portion packs about 7.6 g of protein and 222 mg of calcium; the cottage cheese provides 9.4 g and 127 mg respectively. The Cheddar is taking up less room, but it has brought plenty to the table. [1,2]
That contrast gets you straight to the heart of cheese nutrition. Much depends on how much water, milk solids and fat remain in the finished cheese, and how much of it reaches your plate. [1,2]
Three cheeses, three different stories
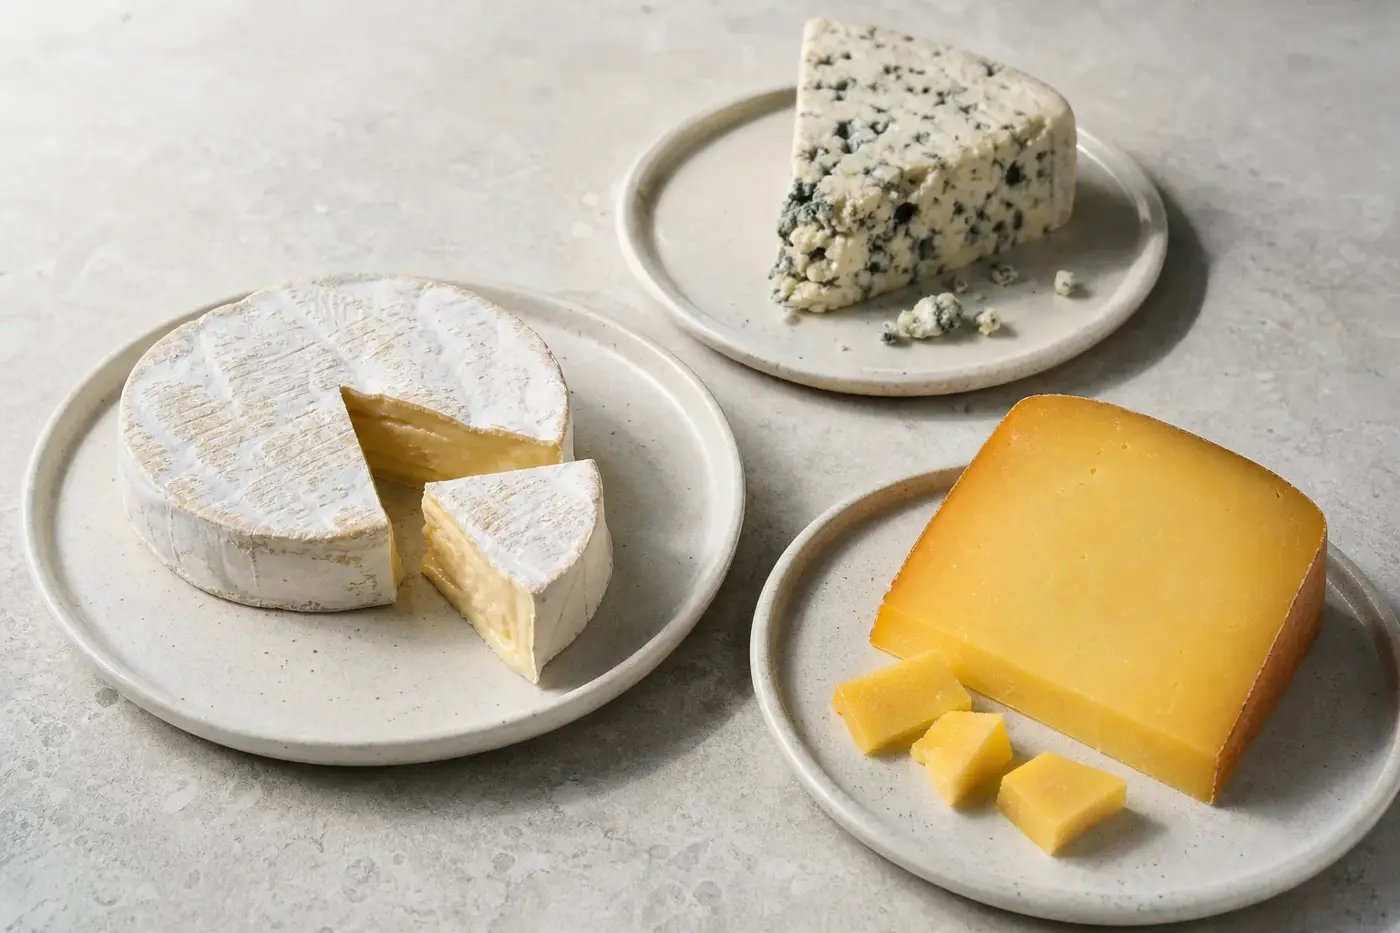
A block of hard cheese, a soft processed spread and a pot of fresh curds bring different nutritional profiles to your plate. Dairy UK's published tables for regular Cheddar, plain regular cheese spread and plain regular cottage cheese give you a consistent UK reference for comparing them. For the product you actually eat, turn to its pack label. [1]
| Your cheese | Protein per 100 g | Calcium per 100 g | Protein per 30 g | Calcium per 30 g |
|---|---|---|---|---|
| Cheddar, regular | 25.4 g | 739 mg | 7.6 g | 222 mg |
| Cheese spread, plain regular | 11.3 g | 498 mg | 3.4 g | 149 mg |
| Cottage cheese, plain regular | 9.4 g | 127 mg | 2.8 g | 38 mg |
Source: Dairy UK, Nutritional composition of dairy. Values describe the whole food as eaten. The illustrative 30 g values are calculated and rounded to one decimal place for protein and whole milligrams for calcium. [1]
Look down the columns and you will see that protein and calcium do not climb together in fixed proportions. A cheese can provide useful protein without matching a hard cheese's calcium concentration. Cheese spread needs its own comparison, too: its formulation differs from both a block of hard cheese and a pot of fresh curds. [1]
Let your portion do the maths
Start with the value per 100 g, multiply by your serving weight in grams, then divide by 100. For a 30 g portion, your multiplier is 0.3; for 60 g, it is 0.6. You can use the same calculation for protein, calcium, fat, saturated fat, energy and salt.
Take Cheddar's 25.4 g of protein per 100 g. That becomes 7.62 g in 30 g, rounded here to 7.6 g. Keep the unrounded figure through the calculation and round only the result, otherwise equivalent portions can appear different. [1]
Use the amount you actually put on your plate. That might be 20 g for a topping, 30 g for a sandwich or 100 g of cottage cheese as part of a meal. These are calculation examples, not instructions: your portion depends on your appetite, the dish and the rest of the meal.
What water and ageing bring to the story
Water adds weight, but no protein or fat. When less water remains in a cheese, its other components can become more concentrated per 100 g. The UK's 2002 food composition tables recorded 36.6 g of water per 100 g for Cheddar, compared with 48.7 g for Brie sampled with the outer rind removed. [2]
That helps explain why fresh, moist cheeses often differ from firm cheeses. The balance of milk protein, fat and minerals matters too. Softness will not tell you the fat content: a soft cheese made with added cream can contain substantial amounts, while a fresh cheese made from lower-fat milk can have much less. [2,3]
Milk species, milk fat level and recipe shape the starting material; draining and ripening shape the finished cheese. Ageing can bring further moisture loss, but the nutrition panel on the back tells you more than a maturity word on the front. However distinguished that word sounds, compare finished products rather than assuming that older, harder or made from a particular animal's milk means more of every nutrient. [2]
Protein and calcium: what they do for you
Protein supplies amino acids for building and maintaining body tissues, and it provides energy. Cheese is one source, alongside beans, lentils, eggs, fish and meat. The NHS Eatwell Guide includes a range of protein foods within a balanced diet. [4,5]
UK government reference nutrient intakes for protein vary by age and sex. Think of them as population context, not a measure of your own requirements. SACN explains that protein requirements are based on body weight, so a label's reference intake and your individual needs answer different questions. [5,6]
Calcium helps build bones and keep teeth healthy, regulates muscle contractions and supports normal blood clotting, according to the NHS. Its UK recommendation for adults aged 19 to 64 is 700 mg a day. Against that figure, your illustrative 30 g portion of Cheddar supplies about 32%, and 100 g of plain cottage cheese about 18%. [1,7]
You do not have to get your calcium from cheese. Other sources include calcium-fortified soya drinks, bread made with fortified flour and fish eaten with their bones. Cheese can contribute to a varied diet without being essential to it: you are aiming for a combination of foods that meets your needs. [7]
Fat and saturates: get to know both lines
The “of which saturates” figure belongs inside total fat. It is not an extra amount to add on. Total fat includes saturated and unsaturated fats; as NHS guidance explains, fat provides essential fatty acids and helps your body absorb vitamins A, D and E. [8]
| Your cheese | Total fat per 100 g | Saturated fat per 100 g | Total fat per 30 g | Saturated fat per 30 g |
|---|---|---|---|---|
| Cheddar, regular | 34.9 g | 21.7 g | 10.5 g | 6.5 g |
| Cheese spread, plain regular | 18.6 g | 12.9 g | 5.6 g | 3.9 g |
| Cottage cheese, plain regular | 6.0 g | 3.2 g | 1.8 g | 1.0 g |
Source: Dairy UK. Figures are grams of fat in the whole food; serving values are calculated and rounded to one decimal place. [1]
Fat contributes 9 kcal (37 kJ) per gram, compared with 4 kcal (17 kJ) for protein in NHS explanations. That gives fat content a strong influence on cheese's energy value. Serve less and you reduce the energy, fat and saturated fat together. [8]
SACN's UK recommendation is for saturated fat to provide no more than about 10% of total dietary energy as a population average. Its statement distinguishes that population recommendation from individual requirements. The NHS advises replacing some saturated fat with unsaturated fat, so both principles concern your whole diet, including what you eat alongside cheese. [6,8]
Choosing less fat? Give salt its own look
Fat and salt need separate attention. Dairy UK's tables give plain regular cheese spread 18.6 g fat and 730 mg sodium per 100 g; its reduced-fat reference has 7.2 g fat and 750 mg sodium. The UK label conversion, sodium multiplied by 2.5, gives approximately 1.83 g and 1.88 g of salt respectively. [1,9]
Here, lower fat does not mean lower salt. Look directly at the nutrient you want to change, rather than letting a prominent claim stand in for the whole panel. The NHS describes more than 1.5 g salt per 100 g as high. [3]
Meet the nutrients beyond the headlines
Cheese can also provide vitamin B12, phosphorus and vitamin A, in amounts that differ between products. The NHS explains that vitamin B12 supports red blood cell formation and normal nervous system function. Phosphorus helps build bones and teeth, while vitamin A supports vision in dim light and normal immune function. [10,11,12]
Changing cheeses can therefore change more than the fat content. Give these nutrients a look alongside the headline figures. If a pack does not list calcium or a vitamin value, consult an appropriate food composition entry for a broad comparison, or ask the manufacturer for product information.
Make the nutrition label work for you
- Start with per 100 g. Where a nutrition panel is available, these figures let you compare products at an equal weight. You may also find portion information. [9,13]
- Read both fat lines. Compare total fat and saturates, then check protein and salt. A front-of-pack claim gives you only part of the story. [8]
- Check your serving weight. Recalculate if the manufacturer's portion differs from yours. A slice, spoonful or handful becomes a useful measure only when you know its weight.
- Keep reference intakes separate from your needs. Label reference figures help comparison; dietary recommendations describe populations. Calcium percentages on labels may use a different reference from the NHS adult recommendation above, so compare milligrams before percentages. [5,9]
For the wider packaging picture, see how to read a cheese label. The nutrition panel helps you understand a product, but it cannot tell the whole story. [9]
Give cheese a place in your whole meal
Balance is something to consider over a day or a week, not a diagram every meal must match. The NHS Eatwell Guide places dairy or alternatives alongside vegetables, fruit, starchy foods, protein foods and unsaturated oils. Cheese can supply part of that pattern, while other foods bring fibre, variety and different nutrients. [4]
Before comparing cheeses, ask what you want from this particular meal. Is it a calcium contribution, extra protein, a particular amount of saturated fat or a smaller salt contribution? Compare suitable products per 100 g, then calculate the amount you intend to serve, keeping your choice grounded in the food you will actually eat.
Your needs may differ, particularly if a clinician has recommended a specific eating pattern. Ask your doctor or dietitian how general guidance applies to your circumstances. Lactose and milk allergy are separate questions: read lactose in cheese and cheese allergy versus lactose intolerance for guidance on those distinct topics.
General information only, not medical advice: follow the official guidance where you live.
Questions people ask
How much protein is in Cheddar and cottage cheese?
Dairy UK's figures give regular Cheddar 25.4 g of protein per 100 g and plain regular cottage cheese 9.4 g per 100 g. A 30 g portion of Cheddar provides about 7.6 g.
How much calcium does cheese provide?
Dairy UK's figures give a 30 g portion of regular Cheddar about 222 mg of calcium and 100 g of plain regular cottage cheese 127 mg. The NHS recommends 700 mg of calcium a day for adults aged 19 to 64; see its calcium guidance.
Is soft cheese always lower in fat than hard cheese?
No. A soft cheese made with added cream can contain substantial fat, while a fresh cheese made from lower fat milk can have much less. The page recommends comparing the nutrition panels of finished products.
Does reduced fat cheese spread contain less salt?
Not in Dairy UK's comparison. Its regular cheese spread reference has approximately 1.83 g of salt per 100 g, while the reduced fat reference has approximately 1.88 g.
Does the saturated fat on a cheese label count towards total fat?
Yes. Saturated fat is part of total fat, not an extra amount to add to it. The NHS advises replacing some saturated fat with unsaturated fat; see its guidance on fat.
Sources
-
Dairy UK. Nutritional composition of dairy, linked PDF retrieved November 2026. Tables headed Cheddar, cheese spread and cottage cheese. This is an industry body's reference compilation.
Source PDF. -
Food Standards Agency. McCance and Widdowson's The Composition of Foods, sixth summary edition, 2002. Milk and milk products tables, including food entries 257 and 259. Retrieved copy of the primary reference work.
Source PDF. -
NHS. Dairy and alternatives in your diet, current online version, retrieved November 2026.
Official guidance. -
NHS. The Eatwell Guide, current online version, retrieved November 2026.
Official guidance. -
Public Health England. Government dietary recommendations, August 2016. Adult dietary recommendation tables.
Official PDF. -
Scientific Advisory Committee on Nutrition. SACN statement on expressing energy, fat and carbohydrate intakes and recommendations, current online version, retrieved November 2026.
Official statement. -
NHS. Calcium: Vitamins and minerals, reviewed 3 August 2020, current page retrieved November 2026.
Official guidance. -
NHS. Fat: the facts, reviewed 14 April 2023, current page retrieved November 2026.
Official guidance. -
Department of Health. Technical guidance on nutrition labelling, linked edition retrieved November 2026.
Official PDF. -
NHS. B vitamins and folic acid: Vitamins and minerals, current online version, retrieved November 2026.
Official guidance. -
NHS. Others: Vitamins and minerals, phosphorus section, current online version, retrieved November 2026.
Official guidance. -
NHS. Vitamin A: Vitamins and minerals, reviewed 3 August 2020, current page retrieved November 2026.
Official guidance. -
NHS. Food labels, current search-retrieved version, November 2026.
Official guidance.
This desk-researched article compares published UK composition tables, calculates illustrative servings and checks dietary context against government and NHS publications.
Last checked: November 2026
Last checked November 2026.
The editors suggest you read next
Cheese and Health: What the Evidence Says
Put cheese and butter side by side on your plate.